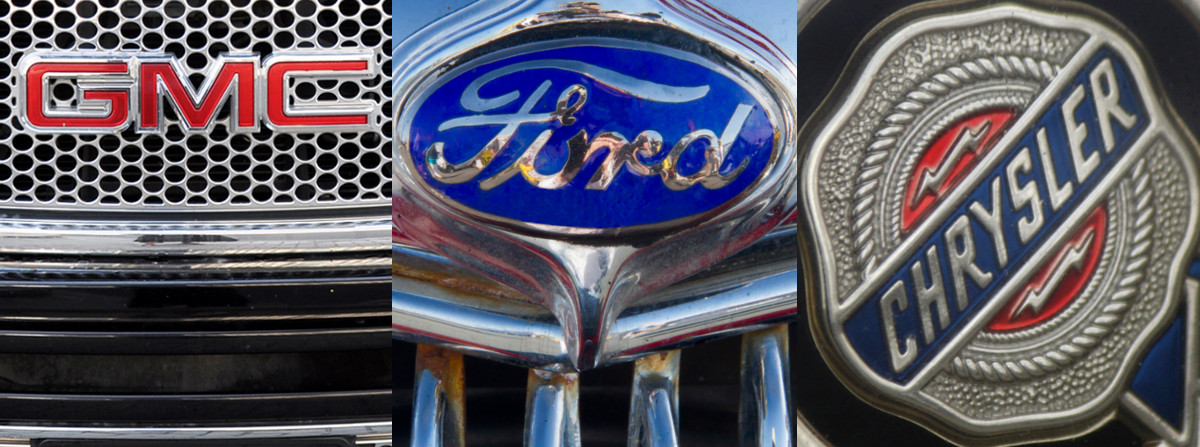
ARCHIVED WEBSITE: No new data posted since May 15, 2009 because on Dec. 19, 2008 President Bush offered the Big Three automakers federal loans. On May 15, 2009 we archived this site - meaning we will (usually) no longer make any updates to it. The site was archived because on Dec. 19, 2008 President Bush offered the Big Three automakers federal loans and our core question was resolved. We continued to present relevant historical and contextual information, and we completed our research efforts in Apr. 2009.
Please note that the site will remain publicly accessible so that our readers can continue to benefit from the information it provides.
For a list of all our websites, please visit www.procon.org. |
-
-
Read statements from Obama, Romney, Krugman, Wagoner, and other VIPs.
-
See the actual agreements the Big Three have with unions, employees and others.
-
Chapter 11 bankruptcy laws and rules detailed here.
-
I. Chart comparing Big Three auto makers to Toyota and Honda
|
|
A. |
B. |
C. |
D. |
E. |
F. |
|
|
GM |
Ford |
Chrysler |
Big 3 Total |
Toyota |
Honda |
| 1. |
US Market Share as of:
- Oct. 2008 1 |
19.9%  |
15.3%  |
11.3%  |
46.5%  |
18.1%  |
10.3%  |
| - Dec. 2007 2 |
23.4% |
15.6% |
12.6% |
51.6% |
15.9% |
9.4% |
| 2. |
Global Sales:
- 2008 Year to Date 3 |
$118.8 billion |
$117.1 billion |
? |
? |
$143.9 billion |
$66.7 billion |
| - 2007 total 4 |
$181.12 billion |
$172.45 billion |
? |
? |
$202.86 billion |
$94.11 billion |
3.
|
Global Cars Sold:
- through Sep. 2008 5 |
6.63 million |
? |
1.18 million |
? |
8.91 million |
? |
| - 2007 total 6 |
9.37 million |
6.55 million |
2.68 million |
18 million |
8.52 million |
3.65 million |
4.
|
Employees:
- Direct (US) 7 |
96,000 |
80,000 |
63,480 |
242,000 |
36,632 |
25,000 |
| - Indirect (US) 8 |
340,000 |
? |
? |
2.5-3 million |
? |
? |
| - Direct (Global)9 |
266,000 |
244,000 |
? |
? |
316,121 |
178,960 |
| 5. |
Revenue per Employee 10 |
$680,910 |
$1,837,925 |
$500,217 |
--- |
$830,043 |
$670,697 |
| 6. |
Average Wage per Hour 2006 (US) 11 |
$39.68 |
$28.88 |
$29.15 |
$32.57 |
$24 |
$24 |
| Average Value of Benefits per Hour 2006 (US) 11 |
$33.58 |
$41.63 |
$46.71 |
$40.64 |
$24 |
$24 |
| Average Hourly Compensation 2006 (US Wage and Benefits)11 |
$73.26 |
$70.51 |
$75.86 |
$73.21 |
$48 |
$48 |
| 7. |
Union Employees? 12 |
Yes |
Yes |
Yes |
-- |
No |
No |
| 8. |
Annual Union Dues per Employee13 |
$952.32 |
$693.12 |
$699.60 |
$781.68 |
nonunion |
nonunion |
| 9. |
# of Legacy Employees 14 |
see footnote |
see footnote |
see footnote |
see footnote |
see footnote |
see footnote |
| 10. |
Annual Cost of Legacy Employees 15 |
$6 billion |
see footnote |
see footnote |
see footnote |
see footnote |
see footnote |
| 11. |
CEO
(since) 16 |
Rick Wagoner (2000) |
Allan Mulally (2006) |
Robert Nardelli (2007) |
--- |
Katsuaki Watanabe
(2005) |
Takeo Fukui
(2003) |
| 12. |
CEO 2007 Compensation 17 |
$14.4 million |
$21.7 million |
$1 salary; full comp. not disclosed |
--- |
$900,000 |
see footnote |
| 13. |
# of Plants (US) 18 |
75 |
36 |
23 |
134 |
8 |
4 |
| 14. |
# of Brands (US)19 |
8 |
5 |
3 |
16 |
3 |
2 |
| 15. |
Income Before Tax 2007 20 |
-$5.73 billion |
-$3.75 billion |
? |
? |
$21.96 billion |
$7.60 billion |
| 16. |
Federal Income Taxes Paid/Refunds Received in 2007 21 |
$37.16 billion |
-$1.29 billion |
? |
? |
$7.61 billion |
$2.41 billion |
| 17. |
Net Profit or Loss
2007 22 |
-$38.73 billion |
-$2.7 billion |
? |
? |
$13.93 billion |
? |
| 18. |
Links to 2007 Annual Reports  23 23 |
GM Report
5.3 MB |
Ford Report
6.2 MB |
Daimler Report
3.7 MB |
-- |
Toyota Report
3.3 MB |
Honda Report
5.7 MB |
| 19. |
Links to SEC Filings:
- Last Quarterly Report
(filing period)  24 24 |
10-Q (9/30/08)
1.1 MB |
10-Q (9/30/08)
516 KB |
Daimler 6-K (10/08)
1.2 MB |
-- |
6-K (10/08)
77 KB |
6-K (10/08)
80 KB |
- 2007 Annual Report (filing period)  25 25 |
10-K (12/31/07)
2.1 MB |
10-K (12/31/07)
(960 KB) |
Daimler 20-F (12/31/07)
4.3 MB |
-- |
20-F (3/31/08)
(4.2 MB) |
20-F (3/31/08)
(488 KB) |
|
|
GM |
Ford |
Chrysler |
Big 3 Total |
Toyota |
Honda |
|
|
A. |
B. |
C. |
D. |
E. |
F. |
Notices for Big Three Auto and Other ProCon.org Information (archived after 30 days)
Archived Notices (archived after 30 days)
Last updated on 5/26/2017 12:09:57 PM PST
|
| RECOMMENDED to you...
|
|
1
|
|
2
|
|
3
|
|
4
|
|
5
|
|
